World Intellectual Property Indicators, 2023- Part 2
Building on the insights shared in last week's newsletter regarding World IP Indicators 2023, further updates into the latest developments in the field of intellectual property.


- Industrial Designs
- Notable 3% decrease compared to the previous year.
- Approximately 1.1 million applications are filed worldwide.
- The first drop since 2014, was observed in 61% of offices globally.
- China experienced a decrease of almost 9,500 applications.
- Republic of Korea and Iran reported substantial drops of 8,019 and 5,804 applications, respectively.

- China's office accounted for 54.8% of all designs in global applications.
- The top 20 offices combined accounted for 95.3% of the total.
- 13 among the top 20 offices recorded annual growth.
- Growth: India (+53.2%), France (+50.8%), Canada (+39.3%), Türkiye (+27.6%).
- Decline: China (–7.9%), EUIPO (–7.9%), Republic of Korea (–4.1%).
- The downturn is evident in both categories, with China contributing significantly.
- Non-resident design count had a substantial decrease, contrasting with 29.5% growth in 2021.
- Played a significant role in non-resident filing activity (33.8% of global activity).
- Türkiye experienced a sharp increase, ranking third globally.
- Standout Growth: Türkiye (+27.6%), Morocco (+11.3%), Italy (+10.9%).
- Substantial Declines: Iran (–41.4%), Russia (–24.7%), Republic of Korea (–11.7%).
- Impressive growth in ARIPO, Indonesia, South Africa, and OAPI.
- Declines in Ukraine (–37.5%), Belarus (–28.7%), Mongolia (–17.5%), Mexico (–13.4%).
- Accounted for 82.8% of the world design count, with China's office contributing significantly (97.5% resident design share).
- Asia dominated (70.3% of designs), followed by Europe (22.4%) and North America (4.4%).
- China (841,164 designs), Türkiye (80,559), Germany (70,346), US (67,349), Republic of Korea (62,014).
- Top 5 origins increased by 4.6 percentage points in the last decade.
- Türkiye (17.4%), China (44.8%), Republic of Korea (48.8%) exhibited the highest resident design counts per USD 100 billion of GDP.
- The Republic of Korea had the most substantial resident design count per million population.
- Intense activity relative to GDP: China, Madagascar, Mongolia, Morocco, Republic of Korea.
Trend in industrial design applications for the top five offices 2003–2022
0:00
/
- Four main sectors (furniture, textiles, tools, electricity) collectively accounted for 54.3% of all classes recorded globally.
- 5.2% decrease from 2021 in applications (1 million registered).
- China contributed to 54.8% of all designs in registered applications.
- Active registrations worldwide increased by 8.8% (5.8 million estimated).
- China led with a 9.7% growth, contributing to almost half of the global total.
- EUIPO registered the largest proportion of processed applications (96.7%).
- High rejection rates at the US, Jamaica, and Indonesia offices.
- Türkiye and the UK had fewer potentially pending applications compared to other major offices.
2. Plant Variety
- 27,260 applications filed worldwide.
- 8.2% increase from the previous year.
- China led with 47.8% of applications (13,027), a 16.4% increase.
- The UK showed a remarkable 316.1% increase, reaching 1,702 applications.
- The United States recorded a decline of 27.7%.

- Asia represented 54.6% of global applications.
- Europe accounted for approximately 29%.
- China's dominance contributed significantly to Asia's leading role.
- China and the UK experienced substantial growth.
- The European Union's CPVO faced an 8.2% decline.
- The US recorded a significant drop of 27.7%.
- Combined share of top five jurisdictions grew to 74.0%.
- China's resident share in applications was the highest at 94.7%.
- China led as the most active filer with 12,357 applications, a 16.9% increase.
- Global dynamics suggest India's potential for a more active role.
- Total titles issued globally decreased by 1.4% (14,920 titles).
- China led in title issuance with 4,026 titles, a 1.2% increase.
- The Community Plant Variety Office (CPVO) experienced a 3.9% increase in titles.
- The US and Ukraine faced declines of 4% and 17.7%, respectively.
- Approximately 161,210 titles are in force globally, a 4.5% increase.
- CPVO, the US, and China held the highest number of active titles.
- India's specific contribution is not outlined, but its agricultural significance implies potential increased participation.
3. Geographical Indications
- In 2022, approximately 58,400 GIs worldwide.
- Europe led with 53.1% of GIs, followed by Asia at 36.3%, Latin America and the Caribbean at 4.3%, Oceania at 3.6%, North America at 2.6%, and Africa at 0.1%. China, with 9,571 GIs, primarily protected three-quarters of them through the trademark system.
- Within the European Union (EU), member states like Germany and Hungary held substantial positions in terms of the number of GIs in force.

- Brazil, Colombia, India, Malaysia, and the United States safeguarded all their GIs through national systems.
- Costa Rica, the Dominican Republic, and Israel heavily relied on the Lisbon System, constituting 96.9%, 97.5%, and 99.2% protection, respectively.
- Armenia and the United Kingdom stood out, with 99.7% and 99.9% of their GIs protected through international agreements.
- Türkiye had an overwhelmingly high share of national GIs at 99.8%, while Bosnia and Herzegovina reported 99.7% foreign GIs.
- More than 90% of GIs in force in Brazil (91.7%), China (94.4%), India (92.8%), Malaysia (94.5%), Thailand (90.8%), and Türkiye (99.8%) were national GIs.
- Conversely, almost all GIs in force in Bosnia and Herzegovina (99.7%) and Costa Rica (99.6%) originated from foreign sources.
- In the global landscape, upper-middle-income economies accounted for 46.3% of GIs, with high-income economies following closely at 43.1%. Lower-middle-income economies contributed 10.6% to the total.
- India, with 429 GIs in force, stood out as a notable participant, emphasizing its commitment to protecting products linked to their geographical origins.
- The breakdown of GIs according to their source revealed diverse patterns. Wines and spirits dominated the global scenario, constituting 50.7% of the total GIs in force in 2022.
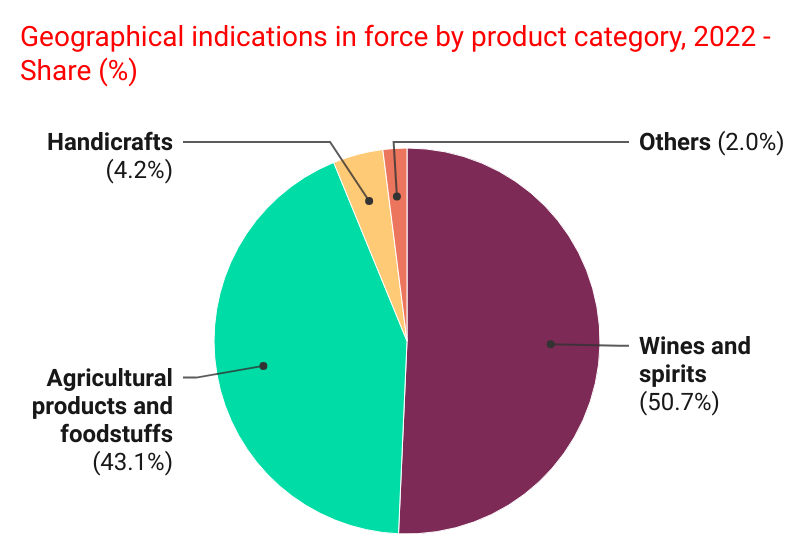
- Agricultural products and foodstuffs accounted for 43.1%, underscoring the significance of these sectors in the GI landscape.
- Handicrafts constituted 4.2% of the total, with Switzerland, India, and Austria reporting substantial numbers.
- Notably, only a handful of jurisdictions, including Brazil, China, Macao SAR, Serbia, and the US, reported GIs for services, showcasing the diversity of products covered.
- In terms of legal means of protection, China reported the highest number of GIs protected via the sui generis system, underlining its commitment to a diverse range of protection mechanisms. The Lisbon System, with 1,039 appellations of origin and GIs in force, demonstrated its influence, with France remaining its primary user.
4. Creative Economy
- In 2022, the combined publishing industry revenue for 23 countries stood at USD 57.3 billion.
- The United States took the lead with USD 26.2 billion, followed by Germany, the United Kingdom, Italy, and France.
- Trade sector revenue accounted for 50% or more of total revenue in 12 of the 20 countries
- The report also highlighted a shift towards digital/audio formats, with Finland reporting the highest share at 39.7%, and Denmark, Finland, and Sweden experiencing a substantial increase.

- Online sales emerged as a dominant channel, contributing significantly to total revenue in countries like (59.3%), the UK (59.1%), and Italy (52.3%)
- Traditional brick-and-mortar stores remained crucial in countries like France, Japan, and Spain.
- Children's books played a significant role, accounting for over one-third of trade sector revenue in Colombia, Denmark, and New Zealand.
- The US led in revenue from children's books, reporting $4.9 billion in 2022.
- The number of titles published also varied, with Turkey leading the way at 206,674 titles, followed by Brazil, France, Italy, and the UK, each reporting over 100,000 titles.

- The legal deposits survey emphasized the importance of national repositories, with the US experiencing a significant increase in deposits, reaching 264,722 in 2022.
- Denmark, Spain, and the UK also saw substantial growth, while Germany and the Republic of Korea reported decreases.
- The format of deposits varied, with Denmark, Germany, and the US having more than two-thirds of deposits in digital format
- In 2022, the United States had 3.3 million registered ISBNs, making it the largest user of the ISBN identifier.

- Japan came in second place with 902,311, followed by the Republic of Korea with 338,237, India with 281,091, and Germany with 277,000.
- Unfortunately, China's 2022 data is not available. Out of 48 countries with available data for 2021 and 2022, 23 reported an increase in ISBN registrations in 2022 compared to the previous year.
- Japan (+717,326), the US (+394,608), and Brazil (+64,928) recorded the largest increases, while Indonesia (-51,474), Ukraine (-16,031), and the UK (-15,793) saw a significant decrease in ISBN registrations in 2022 compared to the previous year.
💡
Written by Shivani, Visualisation by Bhupesh. Originally published in the IP Wave.


