The World IP Indicators 2022, a snapshot of Patents, Trademark & Designs - Part One.


Innovation, technology and digitalisation have become very important driving forces for national and global growth. The world saw extreme disruptions triggered by the pandemic which proved to be a powerful accelerator of innovations that opened new technology frontiers.
Recently, World Intellectual Property Organisations released a report “World Intellectual Property Indicators, 2022”, which reveals strong growth in intellectual property (IP) filings in 2021. Last year saw the strongest pace of growth in the world economy in more than 40 years, with a 6% gain. Below are a few numbers from the report.
Snapshot of Patent Filings:
- 2021 saw the filing of 3.4 million patent applications. Comparing 2021 to 2020, the number of patent applications increased by 3.6%. After a 3% decline in 2019, there was a gain of 1.5% in 2020.


- Out of 3.4 million applications, 2.4 million were filed by residents (representing 70.1% of the total) and 1 million by non-residents (representing 29.9%). Non-resident filings increased by 4.7% in 2021 after falling 2.3% at the height of the COVID-19 epidemic in 2020. In 2021, resident filings climbed by 3.2%, matching the rate of growth from the previous year.
- The number of patent applications received by the China Patent Office in 2021 was 1.59 million, an increase of 5.9% from the number received in 2020. The USPTO came in second with 591,473 applications, followed by the Japanese Patent Office with 289,200, the Korean Intellectual Property Office with 237,998, and the European Patent Office with 591,200. (188,778). The top five offices collectively made for 85.1% of the total worldwide in 2021, a 6.6% increase from their combined proportion in 2011.
- In the list of top IP offices for 2021, Australia, Canada, and India all advanced one position to positions sixth, eighth, and ninth, respectively.
- Computer technology accounted for one-tenth of all patent applications issued globally in 2020, followed by electrical machinery (6.5%), measurement (5.7%), digital communication (5.1%), and medical technology (5%). Since 2012, these five fields have occupied the top five slots in the leaderboard.
- China grew its number of active patents at the quickest rate in 2021 (+17.6%), making it the top jurisdiction for active patents. Germany (+5.2%) and the Republic of Korea (+5.2%) also had rapid growth in 2021, in contrast to Japan's (-0.9%) and the US's (-0.6%) modest declines. Beyond the top five offices, considerable growth was also seen in 2021 in Canada (+5.7%), Switzerland (+5.9%), and India (+19.4%).
- While the US rejected over 351,000 applications, China rejected about 443,000 patent applications. The percentage of applications that were withdrawn or abandoned was highest in Canada (35.8%), Germany (35.2%), and Turkey (53.7%). The German IP office claimed that more than 17,000 applications had been withdrawn or abandoned in absolute terms.
- Women made up 16.5% of all inventors named in PCT applications in 2021, while men made up the remaining 83.5%. Women innovators now make up 16.5% of the total inventor population, up from 10.6% in 2007.
TRADEMARK


Snapshot of Trademark:
In 2021, an estimated 13.9 million trademark applications were submitted worldwide. This is 541,400 higher than in 2020, representing a 4% rise over the previous year.
In 2021, the IP office of China alone contributed for 11.5% of the yearly growth in worldwide trademark filings. However, the IP office of the United Kingdom (UK) had an extraordinarily large percentage in 2021, accounting for 18.1% of the entire yearly rise. These two offices were followed by those of Brazil (10.1%), Turkey (7.4%), India (6.7%), and the European Union Intellectual Property Office (6.2%).
At most offices, trademark applications are filed mainly by residents seeking protection within their domestic jurisdiction. In 2021, residents filing at their home or regional office accounted for 84% of global filing, with the remaining 16% associated with non-resident filings. Over the last decade, the growth in domestic filings has generally outpaced that of non-resident filings.
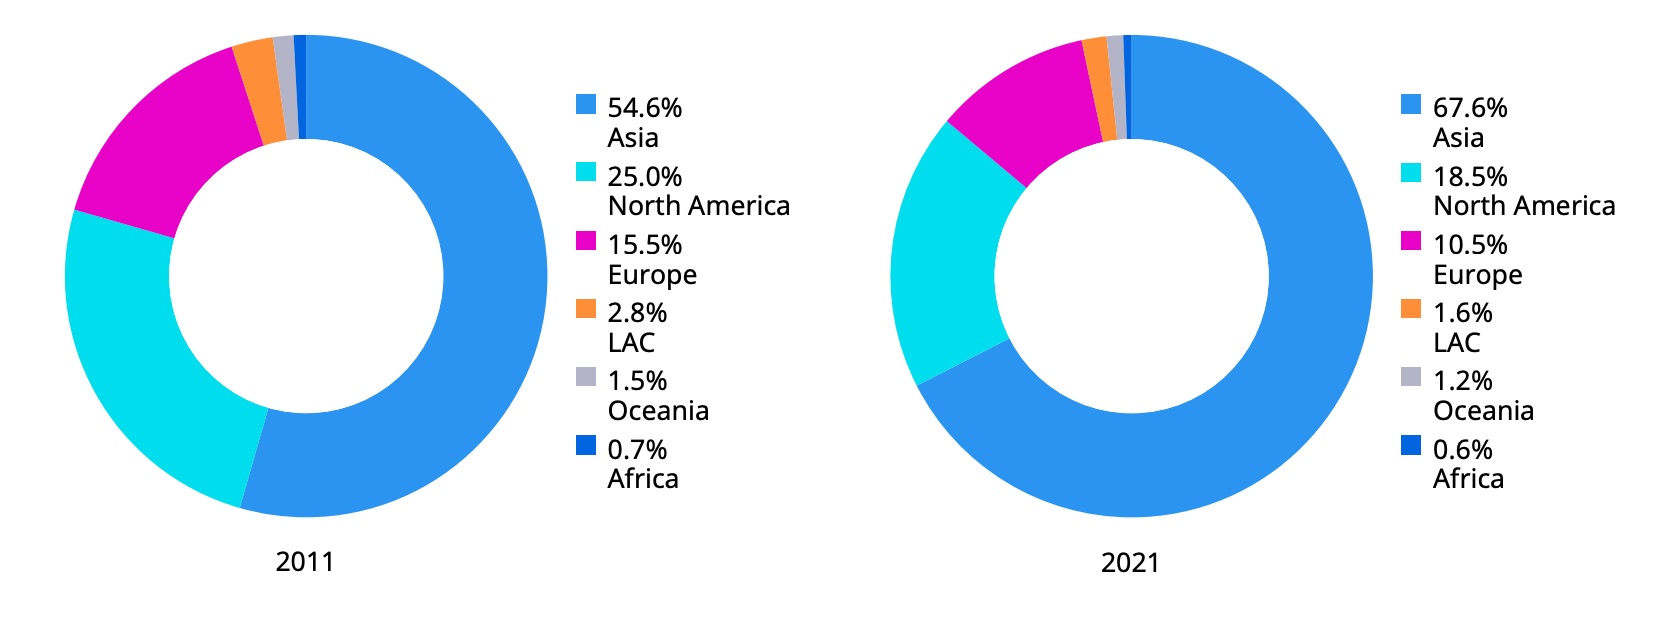
For all trademark filings in 2021, offices in Asia accounted for 69.7%.
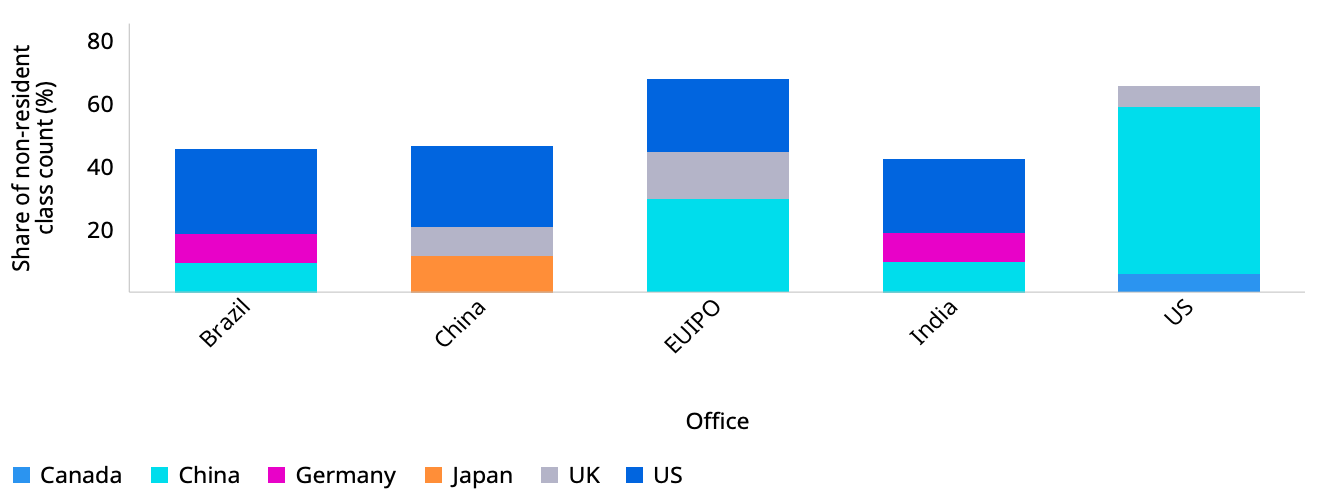
Twenty-five per cent (25.5%) of all non-resident applications filed in China in 2021 were submitted by US applicants, followed by 11.5% of Japanese applicants and 9.5% of UK applicants.
The US (23.5%), China (9.6%), and Germany (9.3%) contributed the biggest percentages to the overall number of non-resident filings in India, making up 42.4% of all non-resident filings there.
At 149 IP offices across the world in 2021, there were reportedly 73.7 million active trademark registrations, an increase of 14.3% from 2020 numbers.
With 37.2 million registered trademarks, the China trademark office had by far the most active trademark registrations in 2021. The US offices, with 2.8 million active registrations, India (2.6 million), and Japan were next (2.1 million).
INDUSTRIAL DESIGN

Snapshot of Industrial Designs:
- Around 1.2 million industrial design submissions were filed worldwide in 2021. This implies a 6.8% increase over 2020 which equates to a 9.2% rise over 2020, the fastest rate of growth since 2013.
- China, India, Turkey, and the United Kingdom contributed the most to the worldwide rise. Non-resident applications containing designs increased by 29.4% in 2021.
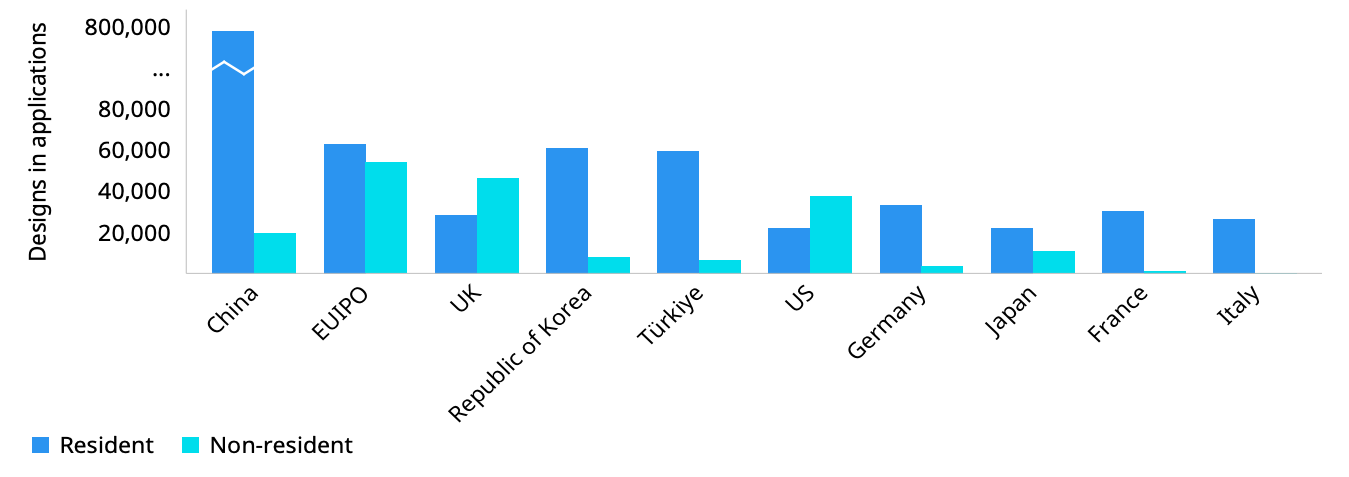
- In 2021, the Chinese office received 805,710 designs in applications, accounting for 53.2% of all activity globally. It was followed by the EUIPO (117,049), the United Kingdom (74,781), the Republic of Korea (69,248), and Turkey (69,248). (65,924)
- The three offices with the highest growth rates were the United Kingdom (+128.5%), India (+67.6%), and Mexico (+38.4%).
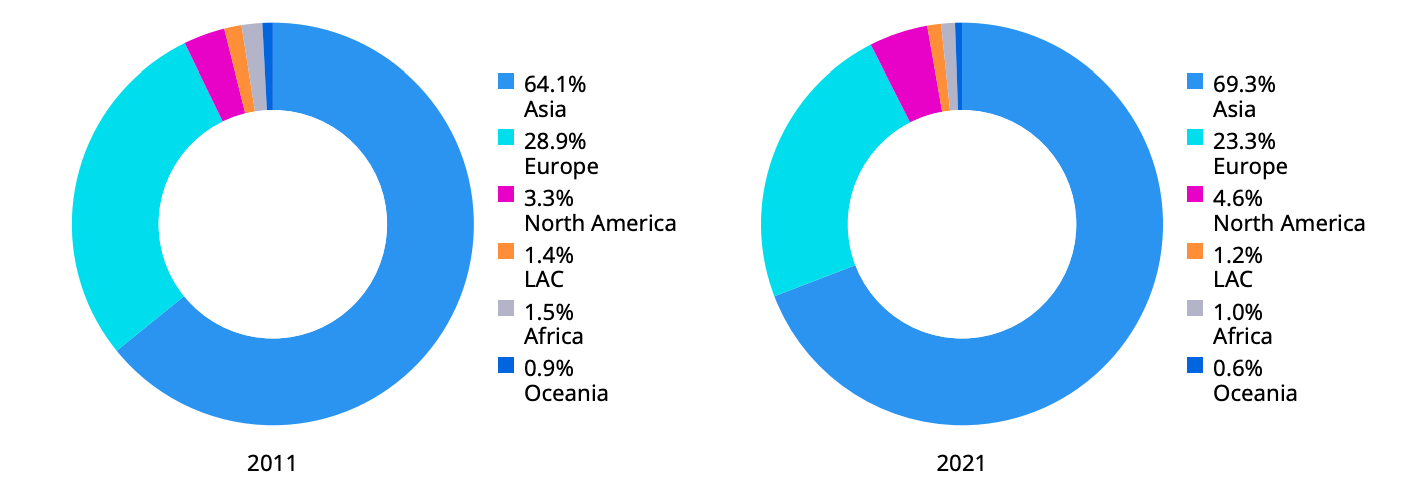
- Asia-based offices accounted for 69.3% of overall filing activity.
- In 2021, Chinese applicants had by far the most designs in applications filed overseas, with 726,985 such designs, indicating a 24.5% yearly growth rate. The number of designs in applications filed outside from China has nearly tenfold increased during the last decade. Following China were Germany (489,249), the United States (370,323), and Italy (312,486).
Since intangible assets are becoming a more significant component of the global economy and there is a constant rise in IP worldwide, IP has evolved into a currency in the era of the creative economy. In recent years, intangible assets have become more significant in determining a company's value. In 1975, intangible assets in the S&P 500, a US benchmark index, made up barely 17% of the entire market value; by 2020, they made up 90%.But we don't yet know how to figure out the economic data for these IPs. Without a comprehensive economic analysis, it is challenging to determine the proportion of intellectual property (IP) in a nation's economy, the economic consequences of new digital technologies and breakthroughs, the economic impacts of overlapping rights, and the effects of giving bundles of rights.


