Russo-Ukrainian War impact on Ukraine’s Foreign Trade
War impact on Ukraine's Foreign Trade


Ukraine is a lower-middle-income country in Eastern Europe. This abstract focuses on the market fact sheet of Ukraine. In 2020, the Covid-19 pandemic caused many global economies to shrink, and various macroeconomic factors showed a sharp decline. Indeed, International trade was equipollent to 66.33% of Ukraine’s GDP in 2020, totalling $103.12 billion of goods exchanged with countries around the world. Ukraine’s exports were only moderately affected, down by 1.72 per cent this was a potential denotement of vigorous inelastic demand for its goods. To put this into context, not only did it better the world average, but it withal significantly outperformed Russia, whose exports fell by 20.87%. As per IMF statistics, Ukraine imported $53.9 billion worth of goods and exported $49.21 billion. In the present scenario, since the full-scale invasion of Russia on February 24, 2022, Ukraine's international trade has been irreversibly disrupted.
Albeit Ukraine was only the 47thlargest exporter in the world in 2020, it specializes in certain commodities, and the world depends on Ukraine for those commodities. The Russian incursion will at least affect Ukraine’s short to the medium-term facility to export these commodities.
Ukraine’s Largest Trading Partners:
Ukraine’s most sizably voluminous trading partner in 2020 was China, with the value of trade between the two countries reaching $15.37 billion, more than double the value of any other trading partner. Followed by Germany ($7.40B), Poland ($7.36B), and Russia ($7.26B) with the majority of trading with these countries was importing goods. India was at ninth position in trading goods with Ukraine.
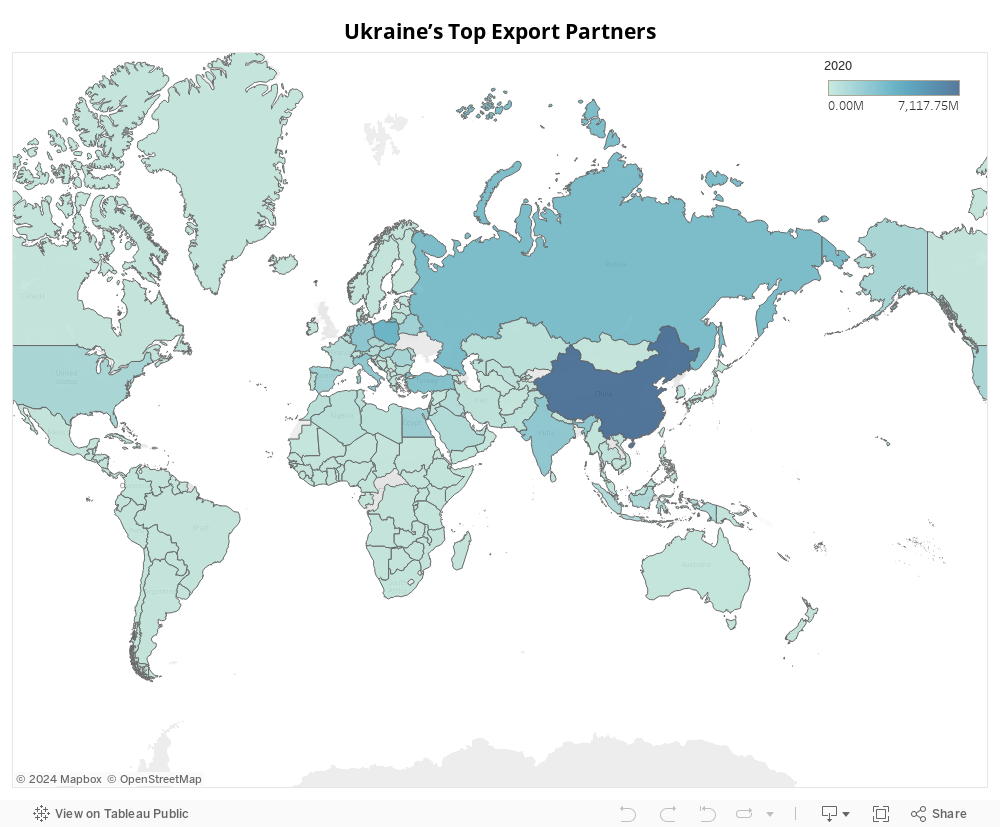
Which countries will be affected if Ukraine's exports decline?
Ukraine’s top 15 export partners in 2020 were China (USD 7.12 billion) 14.46% of Ukraine’s total exports, followed by Poland (USD 3.28 billion), Russia (USD 2.71 billion), Turkey (USD 2.44 billion), Germany (USD 2.07 billion), India (USD 1.97 billion), Italy (USD 1.93 billion), Netherlands (USD 1.81 billion), Egypt (USD 1.62 billion) and Belarus (USD 1.34 billion) and so on. Ukraine’s top 15 export partners accounted for 64.40% of the overall value of export shipments in 2020.
China's close ties with Russia can override its dependence on Ukraine. China relies on Russia for access to Western Europe's export markets and the international financial system. Under the terms of trade, Russia's exports to China are seven times higher (USD 49.58 billion) than Ukraine.
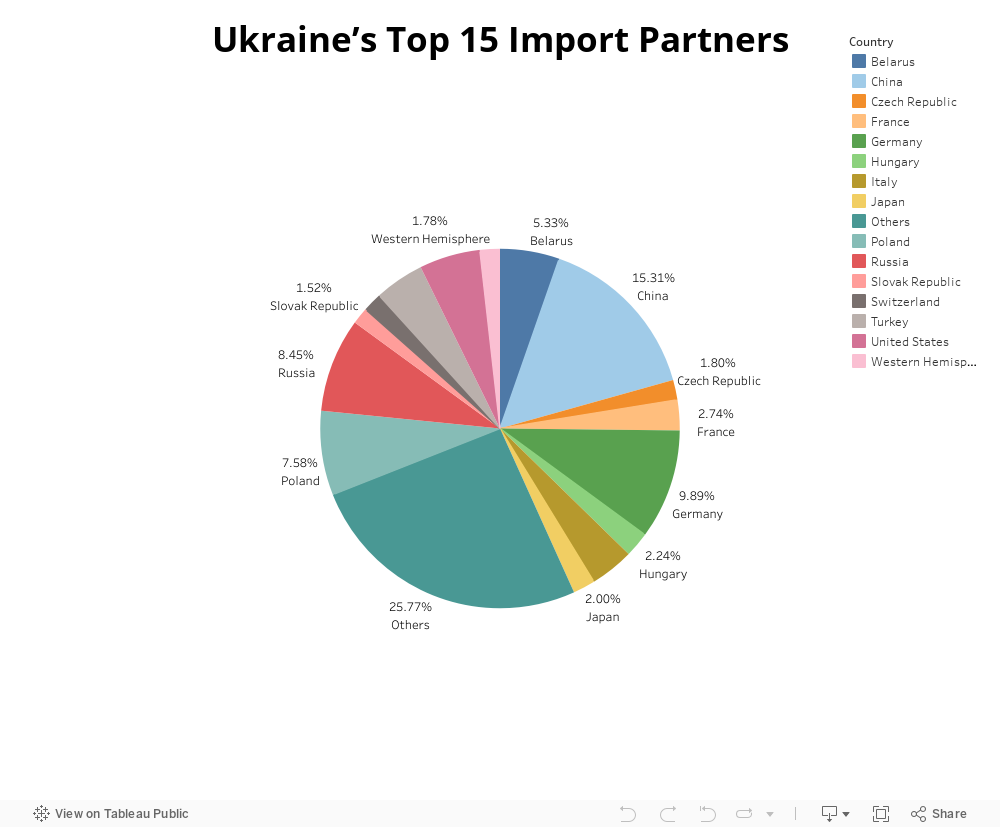
Ukraine’s Top 15 Import Partners:
Ukraine is withal a paramount country in that it imports goods from other countries. A damaged Ukraine indirectly causes damage to other economies as demand for their goods will decline. In fact, Ukraine's total imports in 2020 reached USD 53.9 billion. Ukraine’s top 15 import partners in 2020 were China (USD 8.25 billion), Germany (USD 5.33 billion), Russia (USD 4.55 billion), Poland (USD 4.08 billion), United States (USD 2.95 billion), Belarus (USD 2.87 billion), Turkey (USD 2.41 billion), Italy (USD 2.12 billion), France (USD 1.47 billion), Hungary (USD 1.20 billion), Japan (USD 1.07 billion) and so on. Ukraine’s top 15 import partners accounted for 74.2% of the overall value of import shipments in 2020.
The invasion will reduce Ukrainian import demand:

Ukraine’s top 10 import categories in 2020 were Machines, Equipment, Audio and Video (ME) (21.5%), Mineral Products(MP) (15.2%), Products of Chemical and Allied Industries (PC) (13.6%), Ground, Air and Water Transport Facilities (GA) (10.7%), Plastics and Rubber(PR) (6.4%), Base Metals and Preparations Thereof (BM) (5.8%), Finished Food Industry Products (FF) (5.6%), Textiles (4.2%), Plant Products(PP) (3.6%) and Optical, Medical, Musical Instruments (OI) (2.4%) and Other Goods (11.2%). Ukraine import statistics reveals that Ukraine’s top 10 imports accounted for 89% of the overall value of total imports which entered into the country in 2020.
Invasion will reduce Ukrainian export demand:

Ukraine’s top 10 export categories in 2020 were Plant Products(PP) (24%), Base Metals and Preparations Thereof (BM) (18%), Animal or Plant Fats and Oils(AO) (12%), Mineral Products (MP)(11%), Machines, Equipment, Audio and Video (ME) (9%), Finished Food Industry Products (FF) (7%), Products of Chemical and Allied Industries (PC) (4%), Wood and Articles of Wood (WA) (3%), Live Animals and Livestock Products (LA) (2%) Different Industrial Products (IP) (2%) and Other Goods(8%). Ukraine export statistics reveals that Ukraine’s top 10 exports accounted for 92% of the overall value of total exports which go outside of the country in 2020.
At present Ukraine’s unenviable position, it is likely to demand weapons and aid at this time. If the decline in Ukraine's demand is not absorbed by other countries, the above countries will suffer from many other countries. Some are more likely to be affected than others. Major economies such as the United States and China may switch to other sources, but neighbouring countries will be hit hardest by the potential costs.
Note:
In the CEIC data:
ME category includes:
- Machines and Equipment and Electric Machines.
MP includes:
- Salt, Sulphur, Plastering and Materials
- Ores, Slags, Ashes
- Mineral Fuel and Petroleum Products
PC includes:
- Inorganic Chemicals
- Organic Chemical Combinations
- Pharmaceutical Products
- Fertilisers
- Tanning and Colouring Extracts
- Essential Oils and Cosmetic Preparations
- Soap, Washing and Cleaning Preparations
- Albumens
- Explosives
- Photo and Cinema Articles
- Other Chemical Products
GA includes:
- Locomotives,Rolling-Stock and Trams
- Ground,Facilities Excl Railway
- Aircrafts,Space Apparatus and Parts
- Vessels, Ships,etc.
PR includes:
- Articles of Plastic
- Articles of Rubber
BM includes:
- Ferrous Metals
- Preparations From Ferrous Metals
- Copper and Preparation Thereof
- Nickel and Preparation Thereof
- Aluminium and Preparation Thereof
- Lead and Preparation Thereof
- Zinc and Preparation Thereof
- Tin and Preparation Thereof
- Other Base Metals
- Tools, Cutlery Products
- Other Base Metal Products
FF includes:
- Preparations From Meat, Fish
- Sugar and Sugar Confectionery
- Cocoa and Cocoa Preparations
- Preparations From Cereals
- Fruit Products, Vegetables Processing
- Other Mixed Foodstuffs
- Alcoholic and Non Alcoholic Beverages
- Remains and Wastes
- Tobacco
PP includes:
- Seeding and Other Trees
- Vegetables, Root Crops
- Eatable Fruits, Nuts and Citrus
- Coffee, Tea, Spices
- Cereals
- Flour Grinding Products
- Oil Seeds and Fruits
- Varnishes, Resin (Pitch)
- Plant Materials


