Python Pandas: everything you need to know


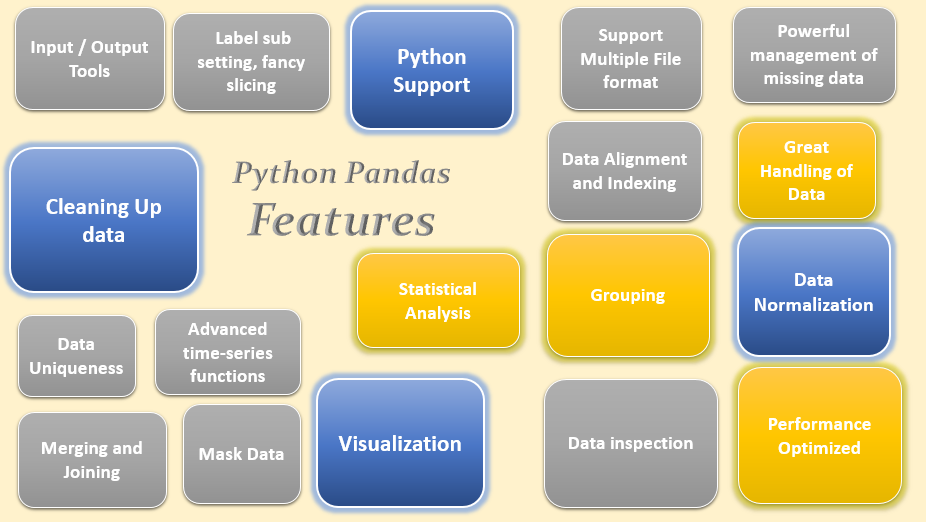
Panel Data analysis is nothing but Pandas, a data science library of rich data structure and tools for working with structured datasets that are common in statistics, healthcare, finance, retail, social science and many more fields. This library provides built-in intuitive routines for performing prevalent data manipulations and analysis. It is the most commonly used open source Python package for data science and machine learning tasks. It is mainly popular for data wrangling, exploratory analysis, powerful, flexible, fastened, visualizing cross sectional and time series data and productivity. Categorically, it provides high-level data structures like the 'DataFrame' and 'Series'.
Getting Started:
Installation and Importing:
To install Pandas, go to command line prompt and just type:
Pip Install Pandas
Alternatively, install Anaconda.
Anaconda is nothing but a zero cost Python meta-distribution that comes with over 250 packages by default installed and over 7500 additional open-source packages from PyPI for scientific computing like machine learning applications, large scale data processing, predictive analysis, data science, etc. Pandas package by default installed by installing Anaconda but you can do it manually by writing:
Conda Install Pandas
Importing Pandas packages:
import pandas as pd
from pandas import *
Pandas Data Structure:
The two primary data structures in Pandas are Series for one-dimensional data and DataFrame for two-dimensional data. Hierarchical indexing is used for data in higher dimensions within the DataFrame.
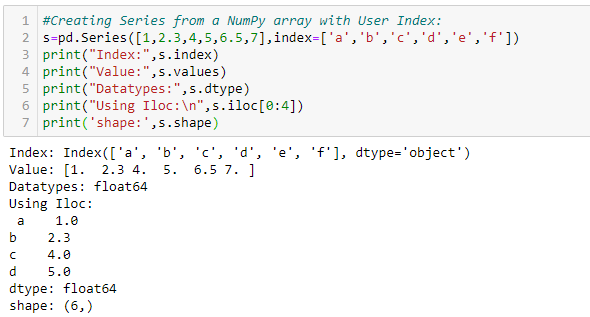
1. Series: A series is a unidimensional array-like data structure capable of holding any data type (integers, strings, floating-point numbers, Python objects, etc.) and an associated array of data labels, called its index. An index is, by default, integer values from 0 to N-1(N is the series's size). We can also specify our own indexes. When a dictionary passes, the resulting series index will take the dictionary's keys in sorted order. In series, we can have duplicate indexes. We can create series using a tuple, list, dictionary, set, and numpy array using the series() function.
Creating a Series:
Series(numpy-array, index = [Generally a list object])
If we don't provide any index value explicitly, a default one is created that consists of the natural integers number 0 through N – 1. Unlike the NumPy array, the index of a pandas Series could be a character vector or something else (other than integers).

A series can be converted into a list or dictionary using the method tolist() or to_dict() respectively.
Series Attributes:
Attributes are the properties of any object. For primitive python data structure, different attributes like Lists or Dictionaries are used, which provide useful metadata about the structure's contents. We can also use Series attributes like values, index, loc, iloc, dtype, shape, nbytes, ndim etc. to find different information about the data structure.
Important Methods:
There are variety of methods attributes that are being useful across the entire spectrum of data wrangling tasks.
|
|
|
|
|
|
Data Wrangling Tasks:
- After peaking the data, head and tail methods are used to view a small sample of the Series or DataFrame object. The default sample of the records to display is five, but we can see a custom number of records.
- Type Conversion: astype method explicitly convert the data types from one to another.
- Treating Outlier: clip method is used to treat outliers at a threshold value. All the values lower than the threshold value will assign to a lower parameter or higher than the threshold value will assign to the upper parameter present in clip methods.
- Replacing Values: The replace method returns the source value with the target value by supplying a dictionary with the required replacements.
- Handling Duplicate values: Duplicated engenders a boolean that marks every instance of a value after its first occurrence as True. drop_duplicates method returns the series with the duplicates removed. If we want to drop duplicated permanently, then pass the inplace=True argument in the drop_duplicates method.
- Dealing with missing data: isnull, notnull methods are used on a Series with missing data to produce boolean series to identify missing or non-missing values, respectively. Both the NumPy np.nan and the base Python None type are identified as missing values.
- Missing values imputation: fillna, dropna, ffill and bfill methods are used to deal with missing data by imputing them with a specific value or by copying the last known value over the missing one, which is typically used in time series analysis. When we sometimes want to drop the missing data altogether, we use the dropna method. One common practice to deal with missing values is a numerical variable by its mean, or median for skewed data and categorical with its mode.
- Uniques and their frequency: unique, nunique, value_counts methods are used to find the array of distinct values present in a Series, count the number of distinct items and create a frequency table, respectively.
- Most significant/Smallest Values: idxmax, idxmin, nlargest, nsmallest methods are used to find the largest, smallest, n-largest, n-smallest, respectively. These methods returned index labels, and this can be especially helpful in many cases.
- Checking values in a list: isin produces a true/false statement by comparing each series element against the provided list. It takes True if the element belongs to the list. This boolean may then be used for subsetting the series.
- Sorting: sort_values , sort_index method used to sort a Series by values or by index. To make the sorting permanent, we need to pass an argument inplace=True.
- Basic statistics: mean, median, std, quantile, describe methods are used for basic statistical calculation employed to find the measures of central tendency for a given set of data points. Quantile finds the requested percentiles, whereas describe produces the summary statistics for the data.
- Apply function to each element: map is the essential method of all series methods. It takes a general-purpose or user-defined function that is applied to each value in the series. It combines with base Python's lambda functions, and it can be a potent tool in transforming a given Series.
- Data Visualization: The plot method is the gateway to a treasure trove of possible visualizations such as histograms, bar charts, scatter plots, box plots etc.
To be continued…


