Innovation in India: India Innovation Index & Nightlight Visualisation of the Indian Economy
As per India Innovation Index, 2022 India’s Gross Expenditure on R&D is one of the world’s lowest, with just USD 43 per capita whereas India’s BRICS or ASEAN counterparts like Russia, Brazil, and Malaysia spend USD 285, USD 173, and USD 293 per capita respectively.


In 1856, a Civil Engineer from Calcutta George Alfred De Penning not only established India’s first Intellectual Property Firm De Penning & De Penning, but also filed India’s first ever patent application on 3rd March 1856 for “A punkah pulling machine”. 5 months later on 2nd September, exclusive rights were granted for his innovation under relevant legislation which was promulgated by the Government of India on 28th February 1856 for encouraging new inventions.
166 years later, innovation is not merely seen as an introduction of new techniques to create new values or renewal of existing products or services by application of new processes but as a fundamental tool for economic development. The post-covid world requires a conducive ecosystem that promotes innovation and technological progress in order to encourage future technological changes that foster positive knowledge spillovers and assimilate and exploit existing information. To foster an innovation-driven economy, policies must be inclusive and sensitive to the country's aspirations and needs.

The relation between innovation and overall economic growth depends on the development status of the nation and its spending on R&D and human capital. In India, R&D investment has been relatively low. The percentage of R&D investment in the country has declined from 0.8% in 2008-2009 to 0.7% in 2017-18 to 0.65 in 2020-21. In a nation like India, where there are more pressing problems like hunger, illness prevention, and improving quality of life, these challenges impede economic progress. As per India Innovation Index, 2022 India’s Gross Expenditure on R&D is one of the world’s lowest, with just USD 43 per capita whereas India’s BRICS or ASEAN counterparts like Russia, Brazil, and Malaysia spend USD 285, USD 173, and USD 293 per capita respectively.
India’s focus on innovation is evident from the number of start-ups founded every year in the country and the unicorns emerging from the lot. As per India Innovation Index 2022, the Department for Promotion of Industry and Internal Trade (DPIIT) has recognised over 61,400 start-ups, with over 14,000 registered just in the financial year 2021–22, up from a mere 733 reported in 2016-17.Recently, the 100th unicorn in India, Neobank Open, brings the nation's unicorn population to an all-time high. According to the Ministry of Commerce & Industry, India is now the birthplace of one unicorn out of every ten throughout the globe. Local purchases are encouraged by programs like Initiative like “Make in India” and “Go Local” which not only encourage local purchases but also support the development of a self-sufficient national economy.
Over the last decade, the startup ecosystem in India has seen tremendous growth. With a total valuation of $332.7 billion, India is now the third largest start-up ecosystem globally, overtaking the United Kingdom and after the United States and China. Bengaluru, the nation’s high-tech capital, has the most unicorns as its headquarters, followed by Delhi-NCR and Mumbai respectively. As per India Innovation Index 2022, Tier 1 cities account for 55% of recognised start-ups, while Tier 2 and Tier 3 cities contribute approximately 45%. For the first time, health-tech companies made it to the unicorn list in 2021. India also registered 47 space tech start-ups in 2021, up from 11 in 2019.Karnataka has topped NITI Aayog’s India Innovation Index 2022, followed by Telangana and Haryana among major states, while Manipur is the best performer among the North Eastern and Hilly States followed by Uttarakhand and Meghalaya. For the UTs and city-states, Chandigarh is the top performer followed by Delhi. Karnataka has held this position in all three editions of the Index.


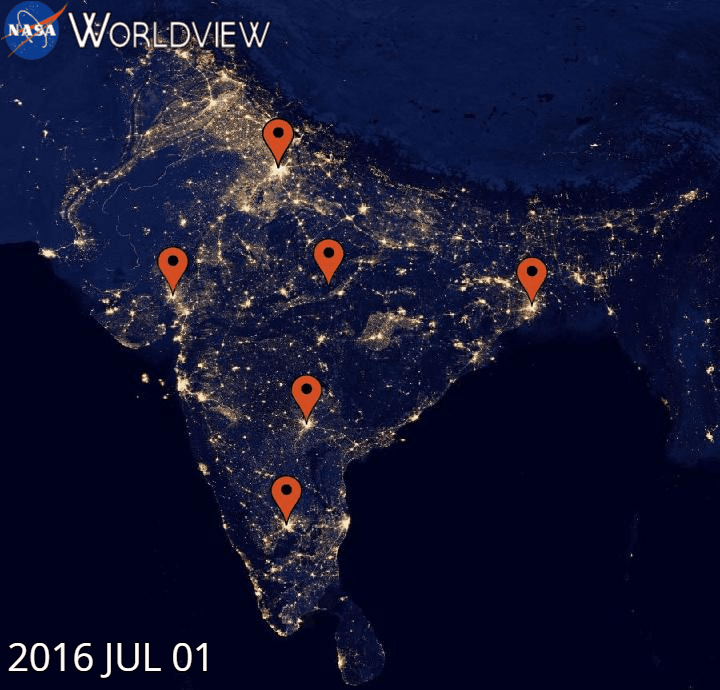
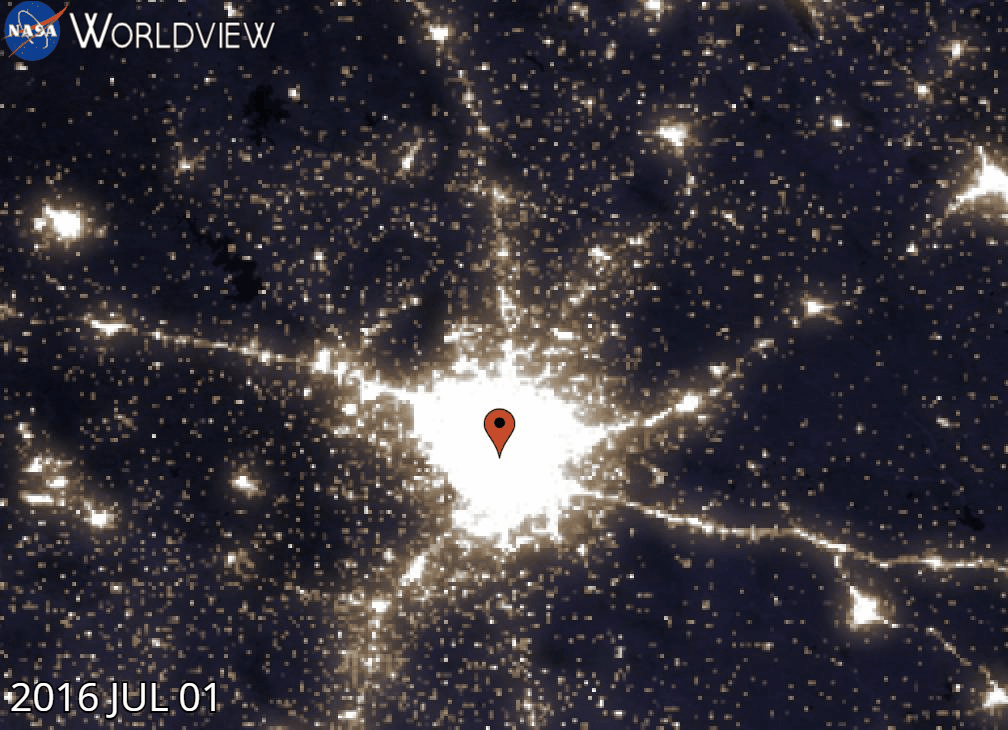
Using Nightlight to Visualize Economy & Innovation Network

India's GDP for FY22 expanded to 8.7 percent highest in 22 years in terms of back series data. The gross domestic product or GDP provides the overall value of the goods and services it engenders and indicates whether an economy is growing or slowing. The International Monetary Fund (IMF) in its World Economic Perspective report released in April 2022, has projected the country's real GDP to grow by 8.2% in FY 2023, down from the 9% forecast it made in January due to the global crisis caused due to the Ukraine war and other geo-political developments. The IMF foresees weaker domestic demand because of higher oil prices due to the conflict as the primary reason for the lower growth projection. For FY24, the IMF expects the Indian economy to grow by 6.9%, as compared to a 7.1% forecast in January. S&P Global Ratings also reduced its real GDP growth projection for the Indian economy for FY23, but to a much slower 7.3% in May. It previously expected the economy to grow by 7.8% in an earlier projection that it released in December 2021. The Indian economy remains one of the brightest spots in the world for sustained growth. We are using night light data to construct a new kind of dataset for analysing the regional impact of innovation and seeing how it spreads as the economic gravity worldwide shifts to Asia, and within Asia the new drivers are moving away from the established urban entities.
The intensity of Nighttime light information is determined from images by NASA worldview. Nightlight data is visible light emitted from the Earth and captured by satellites from space. Data that provide numerical measurements of the Earth's brightness at night are now being used by many economists around the world to study economic activity. We have collected images for major cities like Bangalore, Delhi, Chennai, Ahmedabad, Hyderabad, and Kolkata from Jul-2016 to Jul-2022, and their respective states' GDPs. In 2021, Maharashtra was the highest State GDP followed by Tamil Nadu, Karnataka, Uttar Pradesh, etc. Studies show that long-term average real GDP growth and nightlights have moved closer to each other. The average annual growth rates for GDP and nightlights for the entire period (1992-2017) were 6.5% and 7.1%, but in the period (2018-2021), 5.49% and 3.37% respectively.


We at IP Wave, and Sanrachna Foundation are working on correlating the impact of diffusion of innovation activities across the country and how it is impacting the local economies. There is a lot that such data can inform to firms, public policy professionals, and new startup founders as they make decisions about their consumers and costs. Keep watching this space for this idea. Meanwhile we present the change in nightlight change in India.


